A Day in the Life of a Data Analyst


A lot of people might have difficulty imagining what the day-to-day life of a Data Analyst is like — who are these number-crunching professionals that walk among us, and how do they spend their days? To help you to understand what a career in data could potentially look like, we did the digging to uncover what data analysts really do all day.
You’ve heard the job title “Data Analyst” floating around lately and it sounds like an intriguing career. The idea of working with data and technology has piqued your curiosity. Nowadays, companies receive a tremendous amount of information every day(probably every second) that can be used to optimize their strategies. To get insights from collected massive data, businesses need a Data Analyst who can translate these data and numbers into plain English or beautiful visualization to help organizations make better data-driven business decisions.
A day in the life of a Data Analyst
Analysts can be involved in any part of the analysis process. In a data analyst role, you could be included in everything from setting up an analytics system to providing insights based on the data you collect.
Analysts support various things,
- Collaborate with key business stakeholders to identify specific business challenges which need to be solved
- Collect and organize raw data from internal sources (such as CRM databases) and, where necessary, from external open data sources (for example, government portals and tools such as Google Trends).
- Clean the raw data and decide the best metrics to track.
- Analyze large datasets using the most appropriate technique by conducting (A/B) tests for product/marketing campaign improvement.
- Translate raw data into understandable, extendable dashboards/reports, so that functional teams can extract useful insights from them.
- Interpret the findings, turn them into visualizations (such as graphs and charts), share them with key stakeholders, and advise on strategies and actions for the future. At the same time, You also need to make sure they take actions on a solid quantitative basis instead of pure instinct.
1. Collecting data and setting up infrastructure
Perhaps the most technical aspect of an analyst’s job is collecting the data itself. This often means working together with web developers to optimize data collection.
Streamlining this data collection is key for data analysts. They work to develop routines that can be automated and easily modified for reuse in other areas. Analysts keep a handful of specialized software and tools (database backups, API, social media data, ads data, marketing data, etc.) in their arsenal to help them accomplish data collection.
You will be spending a lot of your time either creating refreshing or running reports. These reports will likely be in the form of Excel or PowerPoint with commentary, and use visualization tools like Power BI, Tableau & Qlik Sense.
2. Data Pre-processing
Data preprocessing is an important step as it requires reading raw data into a more understandable, useful, and efficient format. Real-world data
has noise (i.e., errors or outliers), inconsistency (e.g. date is in
different format mm/dd/yyyy or dd-mmm, etc.), missing data.
Before jumping to data analysis, we must need to transform
data into an efficient format and for that we can follow below few
tasks based on the requirements.
- Data cleaning: We can use the data cleaning method to fill with missing values, smooth, or remove noisy data and outliers along with resolving inconsistencies.
- Data Integration: This task involves integrating data from multiple sources such as databases (relational and non-relational), data cubes, files, etc. This data can be structured, unstructured, or semi-structured in format.
- Data Transformation: This involves the normalization and aggregation of data according to the needs of the data set.
- Data Reduction: During this step, the number of records or the number of attributes or dimensions can be reduced. Reduction is performed by keeping in mind that reduced data should produce the same results as original data.
3. Spotting patterns
The most effective data analysts can use data to tell a story. To produce a meaningful report, a data analyst first must be able to see important patterns in the data. Data is used to find trends and insights that we can use to make recommendations to our clients or stakeholders at the base level.
Reporting in regular increments, such as daily, weekly, monthly, quarterly, or seasonally is important since it helps an analyst notice significant patterns. They all contribute to an overarching time frame where we can see trends over time.
4. Collaborating with others
Surprised to see this on the list? The word “analyst” might make you think of someone working apart from the rest of the company, but that is far from the truth. The wide variety of data analyst roles and responsibilities means you will collaborate across many other departments in your organization including marketers, executives, and salespeople. You will also likely collaborate closely with those who work in data science like data architects and database developers.
5. Producing reports
Analysts spend a significant amount of time producing and maintaining both internal and client-facing reports. Those reports give management insights about new trends on the horizon as well as areas the company may need to improve upon.
Writing up a report isn’t as simple as throwing numbers onto a blank page and sending it to your manager. Data analysts understand how to create stories with data. To remain valuable, the reports, answers, and insights that data analysis provides must be understood by the next decision-maker, who frequently is not an analyst.
Most required skills required for the role:
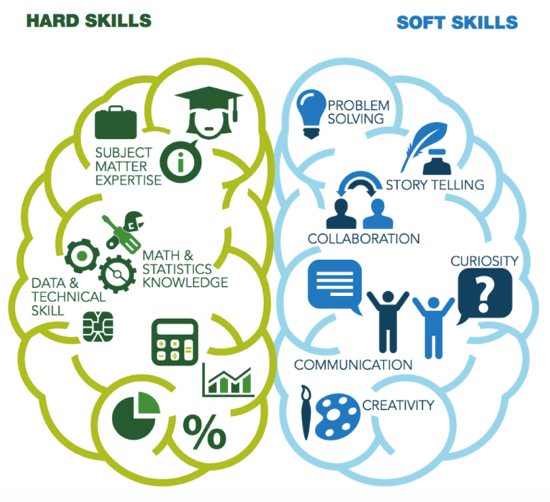
The actual skills the employees may be judged will vary from employer to employer, but is likely a mixture of the following:
- Structured thinking — Can you take ambiguous problems & put a framework around them?
- Problem-solving — Can you provide solutions to problems? Are they out of the box?
- Communication skills — Can you clearly and crisply communicate your thoughts? Can you influence people?
- Crunching numbers — How comfortable are you with numbers?
- Attention to details — Do you pay attention to small details?
- Business understanding — How much depth is there to your business knowledge?
- Technical skills — Your comfort and knowledge of various analytical tools.
- Knowledge of statistics — Do you apply algorithms blindly or genuinely understand what they do?
What tools do data analysts use?
Data analysts rely on various tools to collect and make sense of their data. These are some common tools in a data analyst’s tool belt:
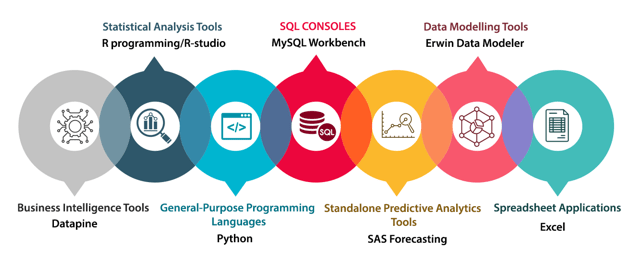
- Microsoft Excel
- SQL
- SAS software
- Google Analytics
- Google Tag Manager
- Tableau / Power BI / Qlik Sense
- Google AdWords
- Python/R
If you like what we do and want to know more about our community 👥 then please consider sharing, following, and joining it. It is completely FREE.
Also, don’t forget to show your love ❤️ by clapping 👏 for this article and let us know your views 💬 in the comment.
Join here: https://blogs.colearninglounge.com/join-us