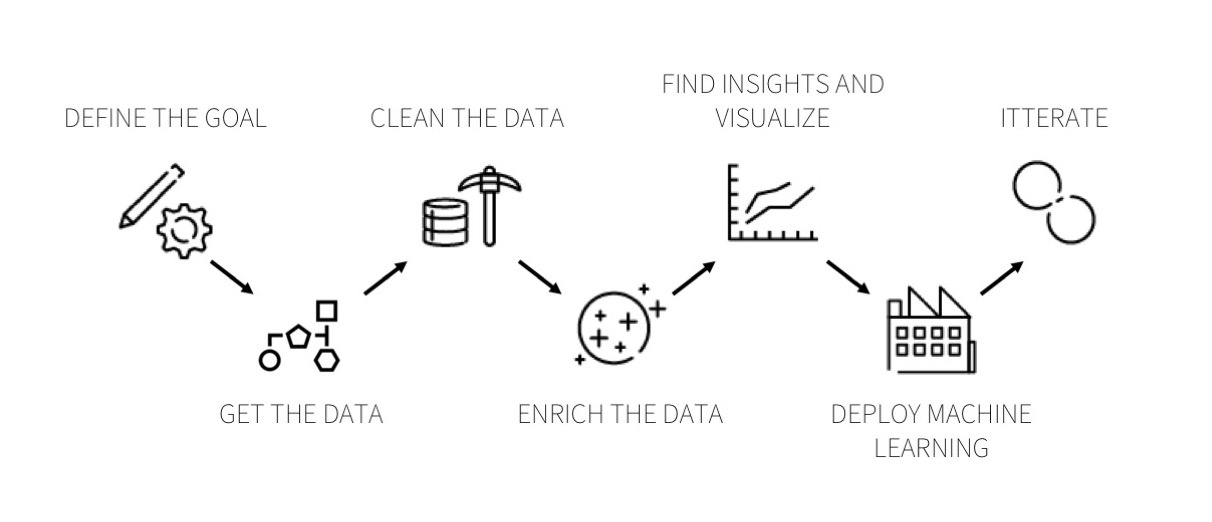
Data Science project life cycle


Any project starts with a well-defined problem statement (like forecasting the sales of an X item in its inventory in the coming month or the cause of customer churn) or a not well-defined problem (like how to increase product sales).
Data science enables us to solve this business problem with well-defined steps. Generally, these are the steps we mostly follow to solve a business problem. All the terminologies related to data science fall under different steps, which we are going to understand just in a while
Step 1: Business understanding
Step 2: Collecting data
Step 3: Pre-processing data
Step 4: Analysing data
Step 5: Data Modelling
Step 6: Model Evaluation
Step 7: Model Deployment
Step 8: Driving insights and generating BI reports
Step 9: Make a decision based on insights
Let us discuss these steps in detail:
Step 1: Business understanding
The business need is the starting point in the life cycle. Hence it is important to understand what the problem statement is and ask the right questions to the customer that helps us understand the data well and derive meaningful insights from the data.
We have all the technology to make our lives easy, but with this tremendous change, the success of any project depends on the quality of questions asked for the dataset.
Every domain and business works with a set of rules and goals. To acquire the correct data, we should be able to understand the business. Asking questions about the dataset will help narrow it down to correct data acquisition.
We typically use data science to answer five types of questions:
- How much or how many? (regression)
- Which category? (classification)
- Which group? (clustering)
- is this weird? (anomaly detection)
- Which option should be taken? (recommendation)
In this stage. you should also identify the central objective of your project by identifying the variables that need to be predicted.
A few right questions that other successful businesses have asked in the past of their data science teams
- Uber — What percentage of the time do drivers drive? How steady is their income?
- Oyo Hotels — What is the average occupancy of mediocre hotels?
- Alibaba — What are the per-square-foot profits of our warehouses?
All these questions are a necessary first step before we can embark on a data science journey. Having asked the correct question, we move on to collecting data.
Step 2: Collecting data
The primary step in the lifecycle of data science projects is to identify the person who knows what data to acquire and when to acquire it based on the question to be answered. The person need not necessarily be a data scientist. Still, anyone who knows the real difference between the various available data sets and makes hard-hitting decisions about the data investment strategy of an organization — will be the right person for the job.
Data might need to be collected from multiple types of data sources.
Few Examples of Data Sources.
- File format Data(Spreadsheet, CSV, Text files, XML, JSON)
- Relational Database
- Non-relational database(NoSQL)
- Scraping Website Data using tools
Our first terminology, BIG DATA, fits here. Big data is nothing but any data which is too big/complex to handle. Big data does not necessarily mean data that is large in science. Four different properties characterize big data; if your data exhibits this property, it is qualified to be called Big data. These properties are defined by the 4 V’s.
– Volume: Data in terabytes
– Velocity: Streaming data with high throughput
– Variety: Structured, semi-structured, and unstructured
– Veracity: quality of the data that is being analyzed
In a retail business, many transactions happen every second by many customers, and a lot of data is maintained in a structured or unstructured format about customers, employees, stores, sales, etc. All this data put together is overly complex to process or even comprehend. Big data technologies like Hadoop, Spark, and Kafka simplify our work here.
Step 3: Cleaning data
Often referred to as the data wrangling phase as well. Data scientists often complain that this is the most boring and time-consuming task involving identifying various data quality issues.
In this step, we understand more about the data and prepare it for further analysis. The data understanding section of the data science methodology answers the question: Is the data you collected representative of the problem to be solved?
This is one task that you will always end up doing. Cleaning data essentially means removing discrepancies from your data, such as missing fields and improper values, setting the right data format, structuring data from raw files, etc.
Format the data into the desired structure, and remove unwanted columns and features. Data preparation is the most time-consuming yet arguably the most important step in the entire life cycle. Your model will be as good as your data. This is similar to washing veggies to remove the surface chemicals. Data collection, understanding, and preparation take up to 70% — 90% of the overall project time.
If you feel the data is insufficient to proceed, you go back to the data collection step.
Step 4: Analyzing Data
EXPLORE… EXPLORE… EXPLORE
Exploratory analysis is often described as a philosophy, and there are no fixed rules for approaching it. There are no shortcuts for data exploration.
Remember, the quality of your inputs decides the quality of your output. Therefore, once you have ready your business hypothesis, it makes sense to spend a lot of time and effort here.
To understand the data, many people look at the data statistics like mean, median, etc. People also plot the data and look at its distribution through plots like histograms, spectrum analysis, population distribution, etc.
Now we create a plan to do analytics on the data. Different types of data analytics can be performed on the data depending on the problem at hand. Different types of analytics may include as below:
💡 Descriptive Analytics (what has happened in the past?)
We can use data aggregation methods tools to provide insights into what had happened in the past.
💡 Predictive Analytics (what could happen in the future?)
We can use statistical methods and other forecast techniques, including data mining and machine learning to understand and estimate what could happen in the future.
💡 Prescriptive Analytics (what should we do?)
We can use optimization and simulation methods to decide and describe possible outcomes for what-if and if-what analysis.

This step of the data science project lifecycle produces no meaningful insights. However, through regular data cleaning, data scientists can easily identify what foibles exist in the data acquisition process, what assumptions they should make, and what models they can apply to produce analysis results.
So, we first determine which type of analytics we intend to perform. This is part of data analytics. After getting structured data from the cleaning operations (generally the case), we perform the data mining operation to identify and discover hidden patterns and information in a large dataset. This is known as data mining.
For example, they are identifying seasonality in sales. Data analysis is the more holistic approach, but data mining tends to find hidden patterns in data only. These discovered patterns are fed to data analysis approaches to generate hypotheses and insights.
Step 5: Data Modelling/ Machine Learning Modeling
This stage seems to be the most interesting for almost all data scientists. Many people call it “a stage where the magic happens.” But remember, magic can happen only if you have the correct props and technique. In data science, “Data” is that prop, and data preparation is that technique. So before jumping to this step, make sure to spend sufficient time on prior steps.
Modeling is used to find patterns or behaviors in data. These patterns either help us in one of two ways —
- Descriptive modeling (Unsupervised learning) — Recommender systems that are if a person liked the movie Matrix, they would also like the movie Inception or
- Predictive modeling (Supervised Learning) — This involves getting a prediction on future trends, e.g., linear regression where we might want to predict stock exchange values


Supervised Learning:
Supervised learning is a technique in which we teach or train the machine using well-labeled data.
To understand Supervised Learning, let us consider an analogy. As kids, we all needed guidance to solve math problems. Our teachers helped us understand what addiction is and how it is done. Similarly, you can think of supervised learning as a type of Machine Learning that involves a guide. The labeled data set is the teacher that will train you to understand patterns in the data. The labeled data set is nothing but the training data set.
The pic below shows Supervised Learning. By doing so, you are training the machine by using labeled data. In Supervised Learning, a well-defined training phase is done with the help of labeled data.
A few examples of Supervised Algorithms:
- Naive Bayes
- Random Forest
- Neural Network Algorithms
- k-Nearest Neighbor (kNN)
- Linear Regression
- Logistic Regression
- Support Vector Machines(SVM)
- Decision Trees
- Boosting
- Bagging
Unsupervised Learning:
Unsupervised learning involves training by using unlabeled data and allowing the model to act on that information without guidance. Think of unsupervised learning as a smart kid that learns without any guidance.
Here are a few examples of Unsupervised Algorithms:
- PCA
- KMeans/Kmeans++
- Hierarchical Clustering
- DBSCAN
- Market Basket Analysis
Below are some of the standard practices involved in understanding, cleaning, and preparing your data for building your predictive model:
- Variable Identification
- Univariate Analysis
- Bi-variate Analysis
- Missing values treatment
- Outlier treatment
- Variable transformation
- Variable creation
Finally, we will need to iterate over steps 4–7 multiple times before we develop our refined model.
Step 6: Model Evaluation
A common question that professionals often have when evaluating the performance of a machine learning model is which dataset they should use to measure the performance of the machine learning model. Looking at the performance metrics on the trained dataset is helpful. Still, it is not always right because the numbers obtained might be overly optimistic as the model is already adapted to the training dataset. Machine learning model performances should be measured and compared using validation and test sets to identify the best model based on model accuracy and over-fitting.
Based on the business problem, models could be selected. It is essential to identify the task, whether it is a classification problem, regression or prediction problem, time series forecasting, or clustering problem. Once the problem type is sorted out, the model can be implemented.
Here are a few examples of Classification metrics:
- Classification Accuracy
- Confusion matrix
- Logarithmic Loss(Log Loss)
- Area Under Curve (AUC)
- F-Measure (F1 Score)
- Precision
- Recall
A few examples of Regression metrics:
- Mean Absolute Error (or MAE)
- Mean Square Error (MSE)
- Root Mean Squared Error (RMSE)
- MAPE
The model should be a robust one and not an overfitted model. If it is an overfitted model, predictions for future data will not come out accurately.
Step 7: Driving insights and BI reports
In this process, technical skills only are not sufficient. One essential skill you need is to tell a clear and actionable story. If your presentation does not trigger actions in your audience, your communication is inefficient. It should be in line with business questions. It should be meaningful to the organization and the stakeholders. Presentation through visualization should be such that it should trigger action in the audience. Remember that you will be presenting to an audience with no technical background, so the way you communicate the message is key.
A few tools used for Viz purposes:
- Tableau
- Power BI
- R — ggplot2, lattice
- Kibana
- Grafana
- Spotfire
- Python — Matpoltlib, Seaborn, Plotly.

Step 8: Model Deployment
After building models, it is first deployed in a pre-production or test environment before actually deploying into production.
Whatever shape or form your data model is deployed must be exposed to the real world. Once real humans use it, you are bound to get feedback. Capturing this feedback translates directly to life and death for any project.
A few frameworks used for Model deployment:
- Flask
- Django
- FastAPI
Popular and widely used cloud providers are,
- AWS
- Azure
- Google Cloud
Step 9: Taking actions
Actionable insights from the model show how Data Science has the power to do predictive analytics and prescriptive analytics. This gives us the power to learn how to repeat positive results or prevent negative ones.
Based upon all the insights we have gathered through observation of data or the machine learning model’s results, we get into a state where we can make decisions regarding any business problem.
A few examples are:
- How much stock of item X do we need to have in inventory? How much discount should be given to item X to boost its sales and maintain the trade-off between discount and profit?
- How much attrition is predicted, and what can be done to avoid the same?
Each step has its importance and will go through multiple iterations back and forth. Multiple people from different technical stacks will coordinate to make a successful deliverable.
Hence, last but not least, communicating with multiple teams is much needed for a smoother completion of the project.
To know more about the technical stacks required in each phase and the roles & responsibilities, check out our article here.
If you like what we do and want to know more about our community 👥 then please consider sharing, following, and joining it. It is completely FREE.
Also, don’t forget to show your love ❤️ by clapping 👏 for this article and let us know your views 💬 in the comment.
Join here: https://blogs.colearninglounge.com/join-us