New to Power BI?: Here’s all you want to know about Power BI

Microsoft’s flagship Business Intelligence tool is debatably the most popular BI tool in the market. With businesses amassing tons of loads of digital information and data lately, BI tools' importance has increased enormously. But what is a Business Intelligence tool? What makes Power BI the leading BI tool out there? This article deep dives into every piece of information you would ever want to know about Power BI.
What are the Business Intelligence(BI) tool and its need?
Business Intelligence (BI) tool is a piece of software/technology that transforms raw data into meaningful and useful information. Any business that deals with data, directly or indirectly, needs a BI tool that facilitates strategic, operational insights and decision-making.
Essentially, with the help of a BI tool, data analysis of business information can be performed. Organizations will be able to get –
- Historical insights
- Dashboards that track timely activity
- Performance indicators and reporting
- Future projections
Leveraging business intelligence is a no-brainer for any organization to have a competitive advantage in this data-rich world.
What is Power BI?
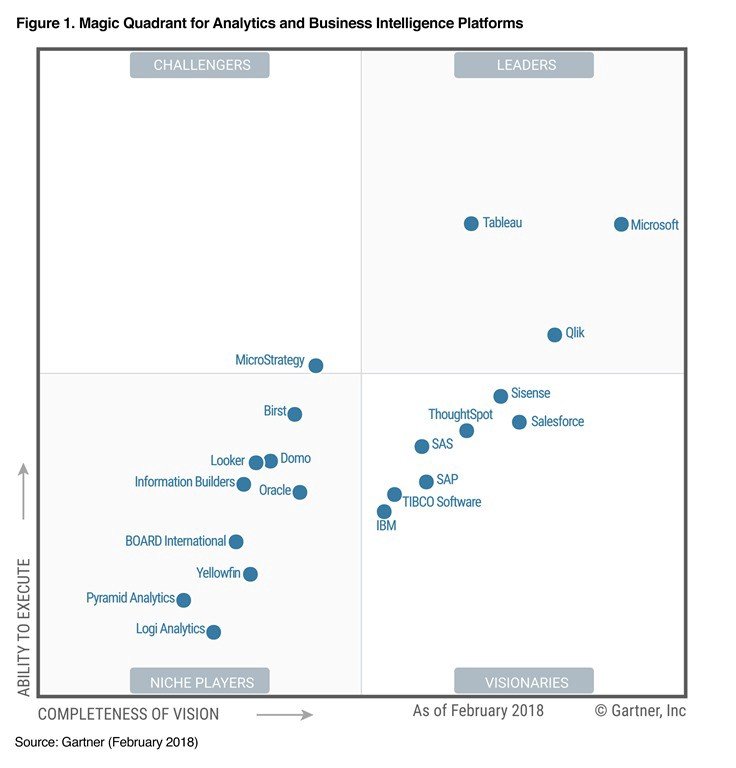
Power BI is the enterprise business intelligence solution from Microsoft. According to Gartner’s research, Microsoft as Enterprise BI has scored highest among top BI tools, ranking top as a market leader.
Microsoft describes it as –
“Power BI is a collection of software services, apps, and connectors that work together to turn your unrelated sources of data into coherent, visually immersive, and interactive insights. Whether your data is a simple Microsoft Excel workbook or a collection of cloud-based and on-premises hybrid data warehouses, Power BI lets you easily connect to your data sources, clean, and model your data without affecting the underlying source, visualize (or discover) what’s important, and share that with anyone or everyone you want.”
The tool is designed to let you create, share, and consume business insights in the way that serves you and your role most effectively. It is an extremely user-friendly and ‘No code’ solution that just lets you build charts and dashboards with a simple drag and drop functionality. This makes Power BI the most widely adapted across different organizations and roles.
How is Power BI used as Business Analytics in an Organization?
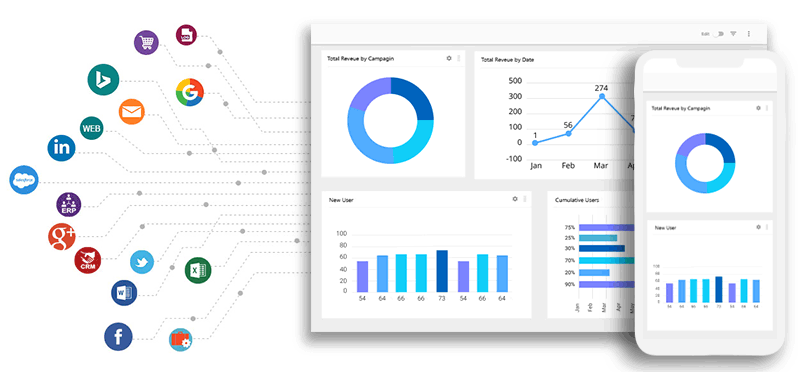
The core functionality of Microsoft Power BI is to run reports and surface insights based on the given business information and data. Power BI can connect to a wide range of data sets, and pre-processes the information so that it can be represented in a visual medium like charts and graphs which helps the user to better understand the insights. The reports and visuals generated from this data can then be shared with other users.
For businesses who want more reporting power and analytical muscle than that offered by Excel, Power BI is the next level in business intelligence. With Power BI
Here are the key features of Power BI which make it an extremely powerful tool –
- Power BI has an intuitive interface that makes it far more user-friendly and easy to navigate than complex spreadsheets.
- Power BI connects to a range of data sources, from basic Excel spreadsheets to databases, and both cloud-based and on-premise apps.
- Power BI is built on the foundation of Microsoft Excel, and it is easy to learn if you are an Excel user, as the learning curve from Excel to Power BI is not that steep; anyone who can use Excel can use Power BI but need some understanding of the data models and framework.
- Its highly customizable capabilities allow users to create dashboards so they can access the data they need quickly
- Its cloud capabilities are a major advantage. Alerts can be set up on KPIs to keep users up to date on important metrics and measurements
- Power BI ensures that the data is safe, offering complete control on user access and restrictions
Components and Versions of Power BI
Power BI is a complete BI suite that majorly comprises a Windows desktop application called Power BI Desktop, an online SaaS (Software as a Service) service called Power BI Service, and mobile Power BI apps for iOS and Android devices.
Power BI consists of several elements that all work together, one can make use of the complete suite. Different offerings from Microsoft –
- Power BI Desktop — Free, a standalone application intended for small to midsize businesses
Power BI Service
- Power BI Pro — Paid per-user license, needed to get access to advanced features and the ability to share reports
- Power BI Premium — Licenses by scale, intended for large businesses and enterprises
- Power BI Mobile — Device-based app for phones and tablets
- Power BI Embedded — A white-label version of Power BI which Independent Software Vendors can embed in their own apps, rather than build their own analytical features
- Power BI Report Server — An on-premise version of the Power BI Desktop app for businesses that need to keep their data and reports on their own servers
Users of Power BI
How you use Power BI may depend on your role in a project or on a team. There is a lot of flexibility and variations in Power BI usage. How you use Power BI can be based on which feature or service of Power BI is the best tool for your situation. Each part of Power BI is available to you, which is why it’s so flexible and compelling.
- Power BI for business users
- Power BI Desktop for report creators
- Power BI Report Builder for enterprise report creators
- Power BI for administrators
- Power BI for developers
The free version of Power BI Desktop is also available for students for learning and work on academic projects.
Components of Power BI
Power BI Desktop and service contain powerful utility-based components that define the workflow of data inside the BI tool. –
Power Query: A data connection component that lets you transform, combine, and preprocess the data from several sources
Power Pivot /Data Modelling: A data modeling tool for creating data models i.e. schemas and relationships within different tables and attributes.
Power View: The data visualization canvas that holds various interactive charts, graphs, maps, and other visuals.
Power Q&A: A recent addition, which is a question and answer engine that lets you ask questions about your data in plain language.
Data connections
With Power BI Desktop, you can connect to data from many different sources. The wide variety of connections possible (200+) can be broadly categorized as –
- File — Excel, CSV, XML, JSON, PDF, Parquet etc
- Database — SQL Server, MySQL, PostgreSQL, SAP, Amazon Redshift, Snowflake, Oracle, etc
- Power Platform — Power BI datasets, dataflows, Dataverse, etc
- Azure — Azure SQL Db, Blob storage, Cosmos DB, Data bricks, Data lake, etc
- Online Services — Sharepoint, dynamics, Salesforce reports, Google analytics, Github, etc
- Other — Web, Blank queries, Spark, Python script, R Hive, etc.
For a full list of available data sources, see Power BI data sources.
Power BI Pricing
There are various options available when it comes to the pricing part of Power BI tools. Power BI Desktop and Power BI Mobile are free, Power BI Embedded is a pay-as-you-go service, and Power BI Pro and Power BI Premium are priced according to how many users will be accessing the platform, and how much they’ll use it.
Power BI Pro Pricing
Power BI Pro costs $9.99 per user, per month.
It comes with Office 365’s Enterprise E5 plan, which costs $35 per user, per month.
Power BI Premium Pricing
Power BI Premium gives you a dedicated resource for your organization, and as such, is priced by capacity. The minimum capacity level available is “P1”, which costs $4,995 per month. An option for bigger organizations/businesses with more than 500 active Power BI users.
Power BI Community
A huge community of developers, analysts, and BI experts back Power BI with numerous forums, blogs, and dev tools. This is a comprehensive list of popular Power BI blogs — Power BI Blog portfolio May 2021 (V1.5)
If you like what we do and want to know more about our community 👥 then please consider sharing, following, and joining it. It is completely FREE.
Also, don’t forget to show your love ❤️ by clapping 👏 for this article and let us know your views 💬 in the comment.
Join here: https://blogs.colearninglounge.com/join-us