Power BI vs Tableau — Which one is better? (The analyst perspective)

Data visualization and analytics have been evolving at a rapid pace in the last few years with the advent of analytics and data science initiatives at companies in order to drive growth. Every year we see new tools in the market competing against the older, more established players in the Data visualization space.
Tableau and Power BI are two of the best enterprise visualization tools available in the market today. Gartner has consistently placed these two tools in the leader’s quadrant in their analytics and business intelligence platforms Magic quadrant for the last few years. There have been many data teams and companies which find themselves comparing the two tools for the same reason, in order to choose the best data analytics tool for their teams.
In this two-part series, we compare the two tools from two perspectives of how the tools are approached. The Analyst and the Developer. The two perspectives differ in the fundamental approach to ownership.
Data or Business analysts within a company, who get their hands dirty with the data, can utilize these tools as self-service business intelligence tools, without dependence on IT/Business intelligence teams to build their analysis for them, which in most cases can be time-consuming. For a data analysis visualization tool to be at the forefront of an analyst’s choice, the following criteria can be usually considered.
- Skills required
- Connectivity options
- Data Visualizations, Storytelling, and Analytics
- Data Preparation
- Pricing
- Community and Customer Support
- Learning and Growth Opportunities
Note: As an analyst, the primary tools that will be used would be Tableau Desktop and the Power BI Desktop. We would be looking at the capabilities of these two tools across the above aspects
Skills Required
As a business analyst, both tools require you to have some level of understanding of Structure Querying Language or SQL, to make the most from the tools. However, both tools do support drag and drop interfacing once you connect to the data, to build a visual.

Tableau
- Uses MDX as the backend language for dimensions or measures.
- Uses an in-built proprietary technology, to enable people to explore data graphically instantaneously.
Power BI
- Uses DAX in measures and calculated columns as the data modeling language.
- Functions as an advanced version of Excel, it is better to have advanced knowledge of MS Excel before working with Power BI.
Both tools require some level of data literacy to gain value from the options available within the tools. These include data preparation.
Connectivity Options

These are defined by Gartner as “Capabilities that enable users to connect to, query, and ingest data while optimizing for performance”. As an analyst, one sometimes has to work with a multitude of data sources within the company. These can include ERP data, CRM data, data residing in a bunch of Excel sheets somewhere, or some cloud data sources. One would love to have one tool to connect and cut across all these varieties of data sources. Both Tableau and Power BI provide good connectivity options for different types of data sources to connect and fetch data for analysis.
Tableau supports more than 75 native connections, including live connections for real-time insights, or data extracts powered by Hyper. Power BI provides access to data from hundreds of supported on-premises and cloud-based sources, such as Dynamics 365, Salesforce, Azure SQL DB, Excel, and SharePoint.
Data source support is broadly categorized into the following
- File
- Database (On-premise and cloud)
- Online data sources (Apps)
- Others (Web services)
Both Tableau and Power BI support almost all traditional file and database connectivity options. Power BI, because of its ecosystem, has more connectivity options, and an almost exclusive connectivity option to all its Azure and PowerApps ecosystems, to which Tableau has limited connectivity.
Even on the online data sources, Power BI has more connectivity options, above and beyond what tableau provides natively.
Data Visualizations and Story-Telling
Creating compelling visualizations, Time to report or Time to the dashboard, the ability to provide interactivity to the end-user (the stakeholders), ease of data exploration, and ease of use form the crux of most data visualization tools. It is here where there are compelling arguments for and against both Tableau and Power BI, depending upon the kind of analyst you speak to.

Philosophy
Tableau always differentiated itself from other tools by providing a slick, easy-to-use interface where the time to report or a dashboard is less. Analysis can be performed seamlessly by a new user, and the learning curve is, according to us, less with Tableau for a started business analyst. Tableau’s philosophy of data visualization sits on the concept of Flow, where the user working with the data can instantaneously get to experiment and test different visuals at different levels of detail.
Power BI, on the other hand, approaches visualization from a template perspective. You first choose the visual, you choose what to fill the visual with, how to format the visual, and then see the final result. It feels less intuitive and more like a visual code-centric tool.
These factors may seem to suggest that while Tableau enables data exploration without IT support and Power BI requires some level of know-how thereby dependency on IT or BI teams to build the visuals. It in fact depends on the business analyst and their level of competency or comfort with working with any tool, even Excel, for that instance. Power BI is known to be in fact an easy-to-use tool, compared to Tableau. Tableau on the other hand is known to be quicker to build a visual, compared to Power BI.
Standard Visuals
Both tools offer traditional business visualizations out of the box, such as Bar, line, area, histograms, bullet charts, treemap, scatterplot, tables, and map-based visuals.
Power BI has native support for more “traditional” visualizations or charts when compared to Tableau. For example, you can natively create a Funnel chart, waterfall chart, a donut chart, or a KPI natively in Power BI, while you need to do customization on the tableau visualization in order to build these charts which are not “out of the box”. For some advanced analysts, this customization is a boon since they can come up with any kind of visual in Tableau, which they view as a positive.
Custom Visuals
Power BI supports integrating third-party vendor visuals into your power bi dashboard or report. Tableau on the other hand does not provide any such option and instead provides customization options to build your own visuals. You can also build your own visuals in power, which are more code-centric. Power bi visuals marketplace enables users to download, trial, and install pre-built packaged visuals that are based on specific use cases or for using non-standard visuals such as Sankey Chart, Tachometer, etc.
Storytelling
A story is a sequence of visuals that work together to convey information or break a story down to provide compelling information to the user. Storytelling is native to Tableau and Power BI as they are both data visualization tools.
Tableau has an option to create a Story, which is essentially a sheet with different visuals embedded in a series. You can create stories to tell a data narrative, provide context, demonstrate how decisions relate to outcomes, or simply make a compelling case. Each individual sheet in a story is called a story point. users can interact with the story to reveal new findings or ask/answer new questions of the data
While Power BI does not have a specific feature such as Tableau’s Story, it does have options such as Smart Narratives, which helps you to address key takeaways, to point out trends, and to edit the language and format for a specific audience
Analytics
Power BI desktop provides the following out of the box analytics functionalities
- Statistical Summary that includes Histogram, Top N
- Outliers using Scatter plot
- Grouping and Binning
- Clustering
- Time series analysis
Tableau has the following out of the box analytics functions
- Summary Statistics
- Trend analysis
- Basic Forecasting
- Clustering
Data Preparation
Real-world data is hard to work with, and most analysts spend 80% of their work setting up the data for their report or dashboard. It becomes imperative that a data visualization tool would / should have in-built data preparation or cleaning capabilities for the analyst to be able to not rely on external tools for the same.
Power BI scores better compared to the tableau in terms of native data preparation/ cleaning options. Once you load your data into Powerbi, Power BI provides options natively for you to model your data. This includes defining relationships between your different data sources (if you have them), and writing code (or using drag-drop functionalities) to clean your data. You can use DAX or M code or the Power Query editor to do different kinds of data cleaning and preparation for your sheets.
Even though Tableau does have inbuilt data preparation or cleaning functions, they are no match to what you can do with Power BI. Tableau has a separate tool called Tableau Prep for this, which in fact is a dedicated Data preparation desktop tool.
Pricing

Pricing of tools is usually one of the most critical pieces of software adoption. Both Power Bi and Tableau provide different options at an analyst level and at an enterprise level. We would look at the enterprise-level options and corresponding pricing when we discuss the developer perspective in part 2 of this blog.
From an analyst perspective, both Tableau and Power BI provide free trials if you want to try out the features available with both tools. As an end-user Tableau desktop provides the following options
- Tableau for Students, a full-time student attending an accredited school can get a 1-year license of Tableau Desktop for free.
- Tableau Public: This is a public (free) version of the tool but with limited capabilities.
- Tableau Desktop For Individuals
- $70 user/month | billed annually
- Includes Tableau Desktop, Tableau Prep Builder, and one Creator license of Tableau Server or Tableau Online
Power BI also offers multiple options of the tool to be used, based on the analyst’s scenario
- Power BI Desktop comes free if you are already licensed with office 365. This is equivalent to the Tableau Public version of the tool.
- Power BI Pro is for heavy business analytics users who use Power BI regularly for both creation and consumption and wish to share data, dashboards, and reports with other Pro users.
The Per-user license is as below
- The Pro plan costs $10/user/month.
- It includes data collaboration, data governance, dashboards with a 360-degree real-time view, and the ability to publish reports anywhere.
In most cases, pricing of the tools would need to be done in conjunction with enterprise-wide adoption, the amount of data, the kind of stakeholders and functionality they would be using, as well as the software preference of the company. There is a multitude of options available at an enterprise deployment level, which we will deep dive into in the next part of this blog.
Community and Customer Support

Tableau clearly has the most inclusive community not only in the data space but also across different tools outside of data. The #datafam is very active on Twitter and other social networks, and there are a lot of community-driven initiatives that are ably supported by Tableau as well. The Tableau forums are of great help for a beginner, and its community of millions plus worldwide users participate in community-driven initiatives such as
- Makeover Monday | A weekly social data project
- Workout Wednesday — #WorkoutWednesday
- You can Join the Tableau Community
Tableau also organizes community focussed conferences and events such as Data Day and the Tableau conference, which are very popular and fun. Tableau also has local user groups as well as online user groups that like-minded folks within a city, a social cause, or atopic can join and attend as well as contribute. User groups can be found at https://usergroups.tableau.com/
Power BI also has good question and answer forums where you can post questions and other users can respond. Beyond the general support/troubleshooting community, however, the power BI community at large is not as strong as Tableau. Power BI just cannot seem to compete in community-driven initiatives. Maybe a learning opportunity for Microsoft there.
Both Tableau and Power BI have dedicated Customer support for questions related to the tool, and are known to be fairly responsive. Customer support will be available for a full year from the date of purchase. Customers will then have to pay a small support fee if they want to continue using the premium customer support feature. Customers can opt for extended support if they so desire
Learning and Growth Opportunities

Tableau and Power BI provide great learning opportunities officially for free to get started with the tools. Microsoft has on their Microsoft Learning Platform, dedicated learning paths and collections for Power BI both for beginners as well as an analyst focussed training. They can be found at Getting started, Power BI for the Analyst
Microsoft also has a dedicated certification called Microsoft Certified: Data Analyst Associate, which can be achieved by preparing and taking the certification exam DA-100: Analyzing Data with Microsoft Power BI. The certification is valid for 2 years and needs to be renewed
Tableau has its official e-learning portal which has courses focused on role-based learning. A beginner can actually get started with their comprehensive free training videos on the Tableau desktop.
Tableau has two certifications for analysts. The Tableau Desktop Specialist is the entry-level certification and the Tableau Certified Data Analyst is the newest certification recently introduced at an associate level. There was a certified associate and a certified professional certificate which are now discontinued as of the date this blog is published. You can learn more about Tableau role-based certifications here.
Tableau certified and Power BI certified professionals have been having an increase in demand in the Data and analytics market. While certifications are not a prerequisite, many clients and companies seem to prefer certified candidates who can showcase their profile over regular candidates.
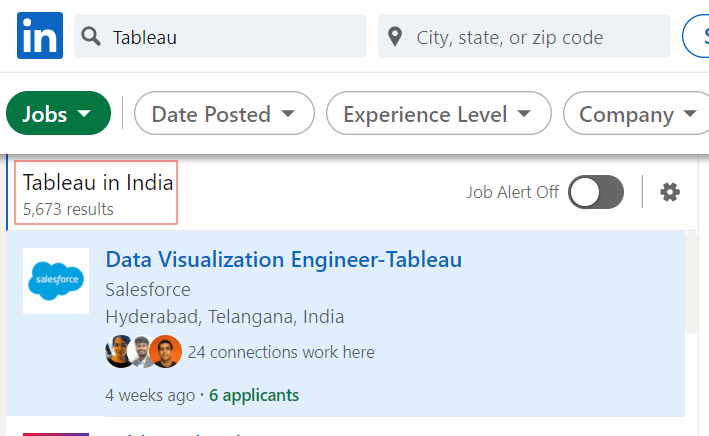
In terms of growth opportunities, Tableau’s adoption drives seem to be driving the number of opportunities available in the Indian market, however, Power BI is slowly catching up in terms of demand. Tableau also provides an option for analysts to showcase their work and skills in their “Tableau Public” portfolio, which is also referred to during hiring.
In Summary, Tableau is more creative and actually tends towards visualization i.e. Tableau works best if you are going for pure visual capabilities. It tends to be the go-to tool for designer analysts who are skilled in and focus on the creative aspect of a visual. In the business world, most people/teams don’t know and don’t need to know how to do things like that, if all they need is a visual aspect of data. Tableau thus works best for the exploratory and the creative data analyst
That is where Microsoft Power BI is a more practical tool, focussing on reporting, thereby is easier to adopt for many organizations and teams. Since Power BI feels more like a more powerful Excel, those on the path of data visualization will feel much more comfortable extending into Power BI. It would feel better, faster than Excel, and cheaper than Tableau! PowerBI is thus better suited for generic analysts/audiences that need an advanced business intelligence cum visualization tool.
That concludes our analyst’s perspective of Power BI vs Tableau. In the next part of this blog, we would review the Developer’s perspective, where we would look at the technical aspects of the tools, especially from an enterprise adoption and IT team’s standpoint.
If you like what we do and want to know more about our community 👥 then please consider sharing, following, and joining it. It is completely FREE.
Also, don’t forget to show your love ❤️ by clapping 👏 for this article and let us know your views 💬 in the comment.
Join here: https://blogs.colearninglounge.com/join-us